Property Insights
Home > Market Analysis > Property Insider
Why the 'Safe' District Could Be The Worst Place To Enter Right Now
April 18, 2026
"A brand-new condo is selling for less than the 3-year-old development next door - $1.75M vs $1.85M+ for the same usable space. This almost never happens. But it's happening right now."
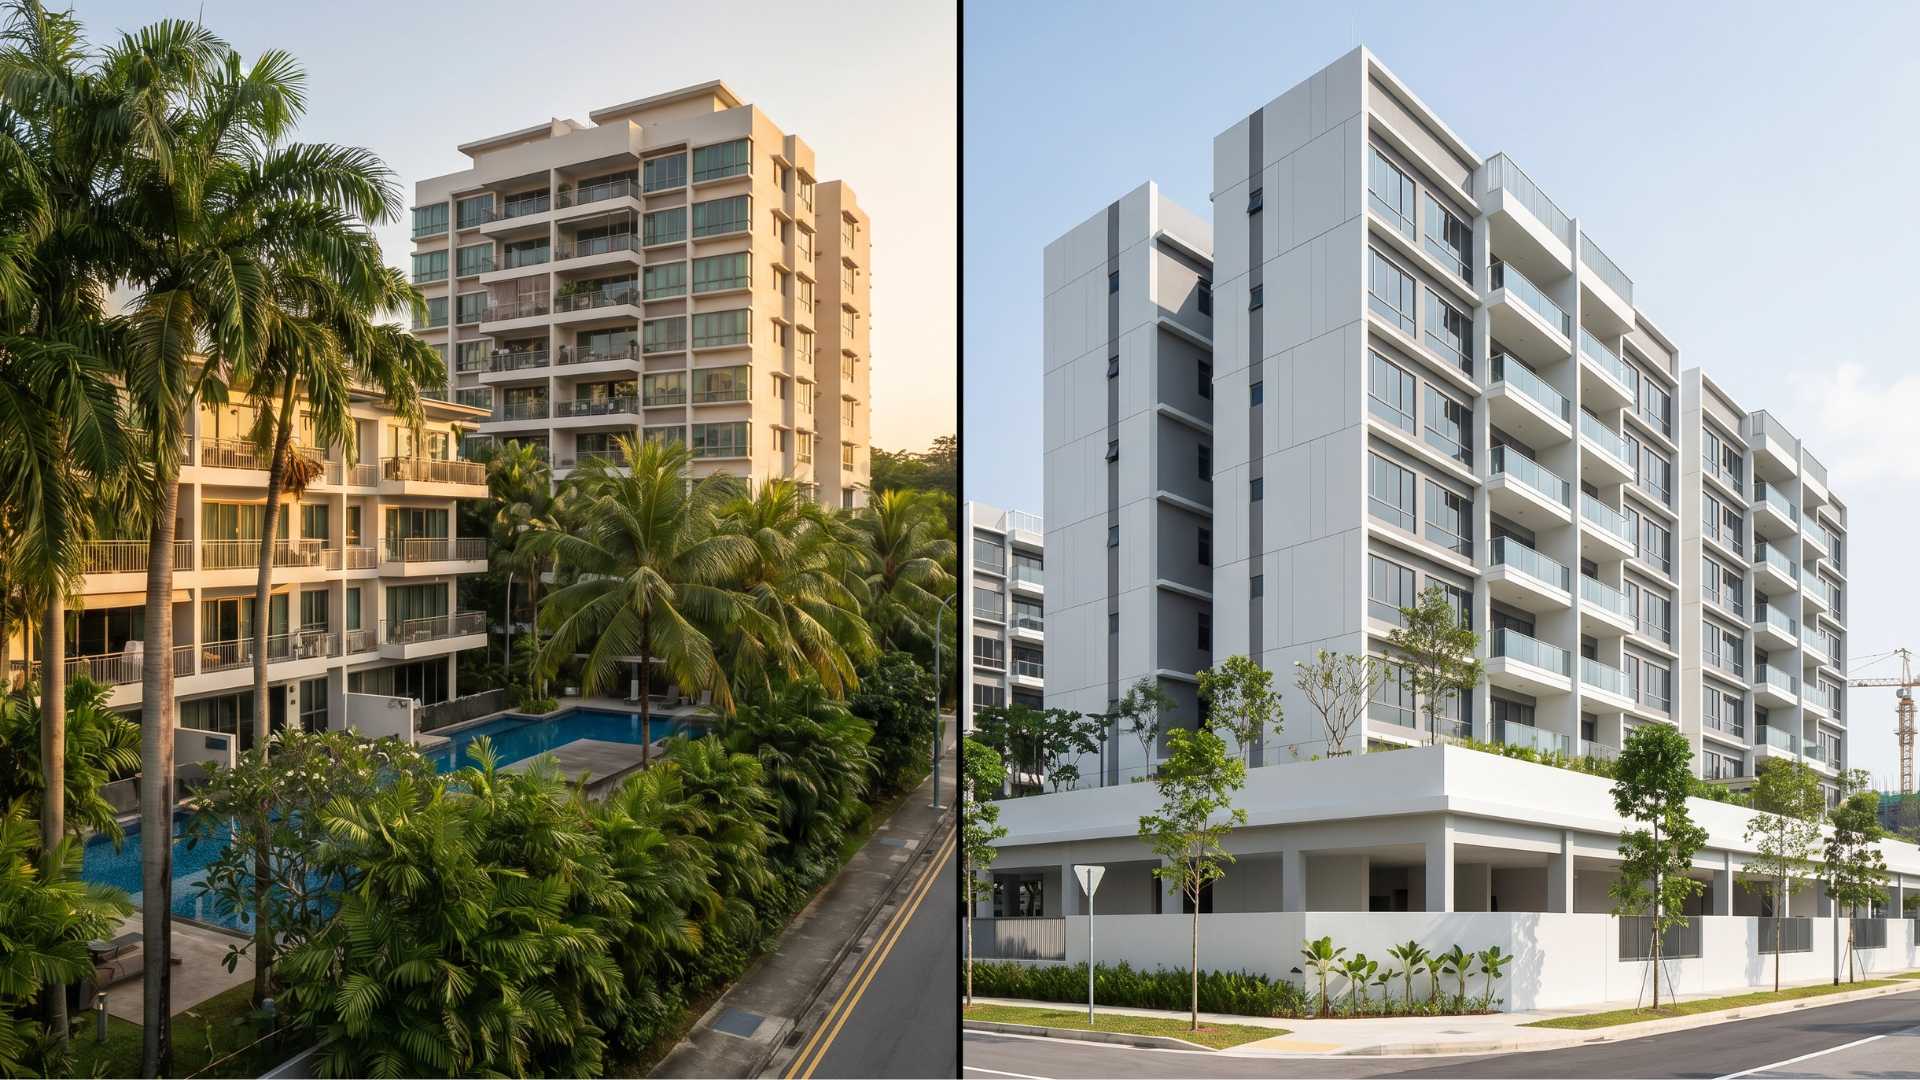
There's a development in Singapore where something strange is happening.
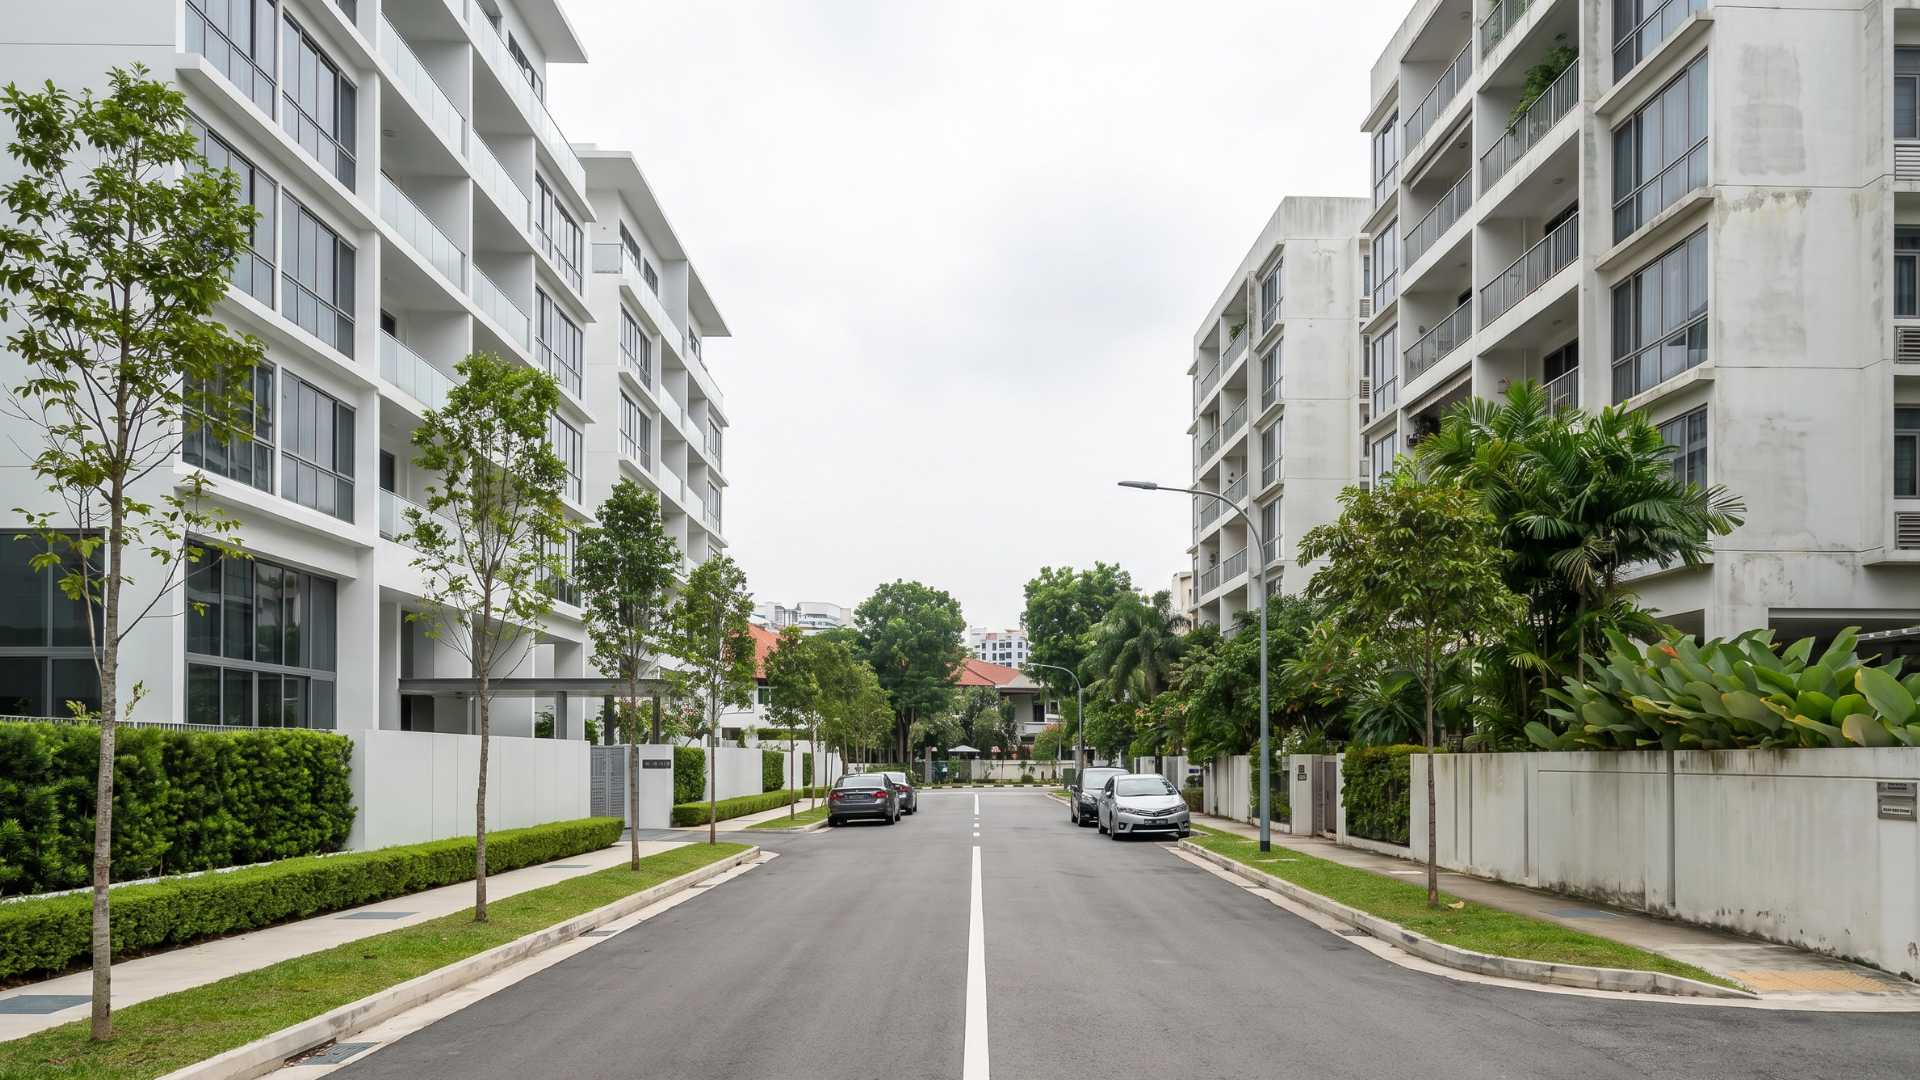
A brand-new condo - fresh 99-year lease, never lived in - is selling 3-bedroom units at $1.75 million.
The development directly across the street? Three years old. Already lived in. Lease already ticking down.
Their 3-bedrooms? $1.85 million and up.
Older unit. Shorter lease. HIGHER price.
In 20 years of watching Singapore property, I can count on one hand the number of times I've seen this happen.
New launches almost always carry a premium over resale.
That's just how developer pricing works - buyers expect to pay more for new.
But here, the math is flipped.
And I'm going to tell you exactly why - and why it matters enormously if you're buying in the next 12 months.
The "$660,000 Gap" Case Study
Two buyers. Two 3-bedroom condos.
Buyer A picked the "safe" choice. East Coast. Mature estate. Great restaurants. MRT running. Schools established.
Everything built, everything familiar. She paid $2,461 psf.
Buyer B picked a neighbourhood most people still called "the cemetery." Bidadari.
Construction dust everywhere. Half the roads weren't realigned yet.
He paid $1,733 psf. His colleagues thought he'd lost his mind.
Six years later?
Buyer B is sitting on $660,000 in profit.
Buyer A made money too, but no where near what Buyer B made.
Same holding period. Same type of unit. Same country.
The difference wasn't luck. Wasn't insider connections. Definitely wasn't a nicer pool.
It was the growth stage they bought into.
The One Question Nobody Asks Before Signing a $2-3 Million OTP

Here's what most buyers do.
Visit the showflat. Walk the model unit. Check the PSF. Ask if the mortgage fits.
Look around and think: "Is this area nice? Do I feel comfortable here?"
If it checks out, they sign.
That's a $2-3 million decision based on a showflat visit and a feeling.
At no point did they ask the question that actually determines how much money they'll make or lose over the next 8-10 years:
"What growth stage is this area in?"
Because 30 years of Singapore property data - through 13 sets of cooling measures, multiple recessions, and every market cycle imaginable - has shown us one thing without exception:
The stage of transformation you buy into determines your returns more than the location itself.
Buyer A bought at Stage 3. Buyer B bought at Stage 2.
That single difference - not location, not timing luck, not insider connections - is what created the $660,000 gap.
Here's how the three stages work...
The 3 Transformation Stages That Determine Everything
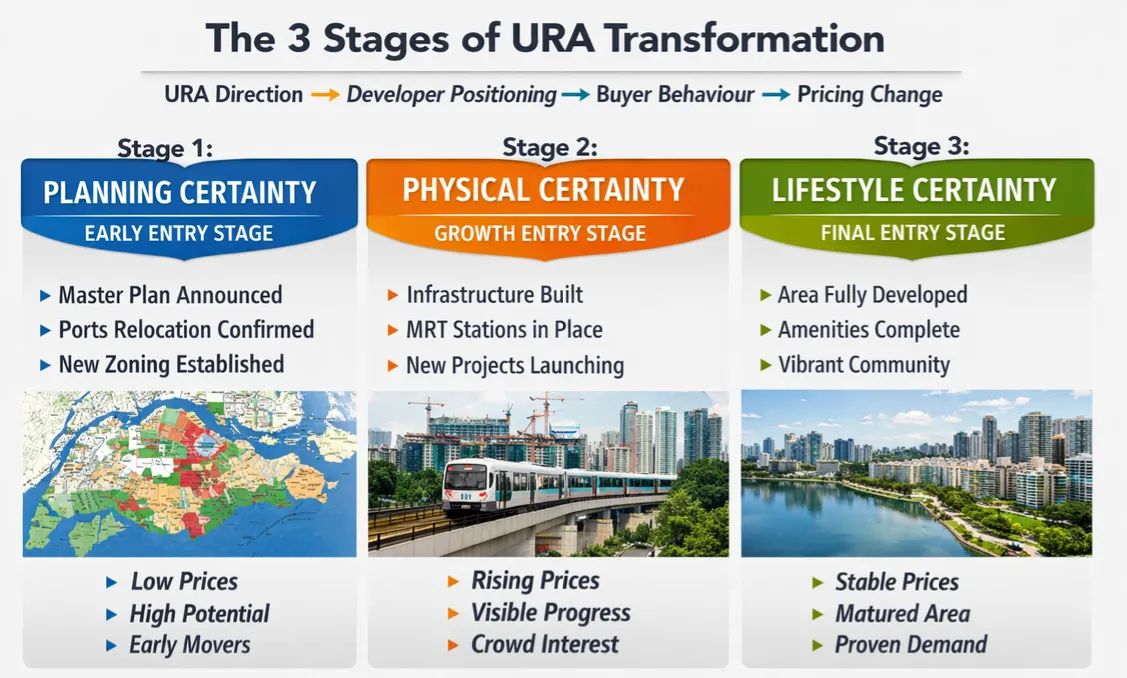
Stage 1: Planning Certainty (Early Entry)
Master Plan announced. Zoning confirmed. Nothing built yet.
Prices are low. Lowest entry prices in the entire cycle.
Example: Paya Lebar Airbase — announced 2013, confirmed in the 2025 Master Plan.
800 hectares of mixed-use development connected by the Cross Island Line.
Development begins 2030s. Lowest entry prices in the entire transformation cycle.
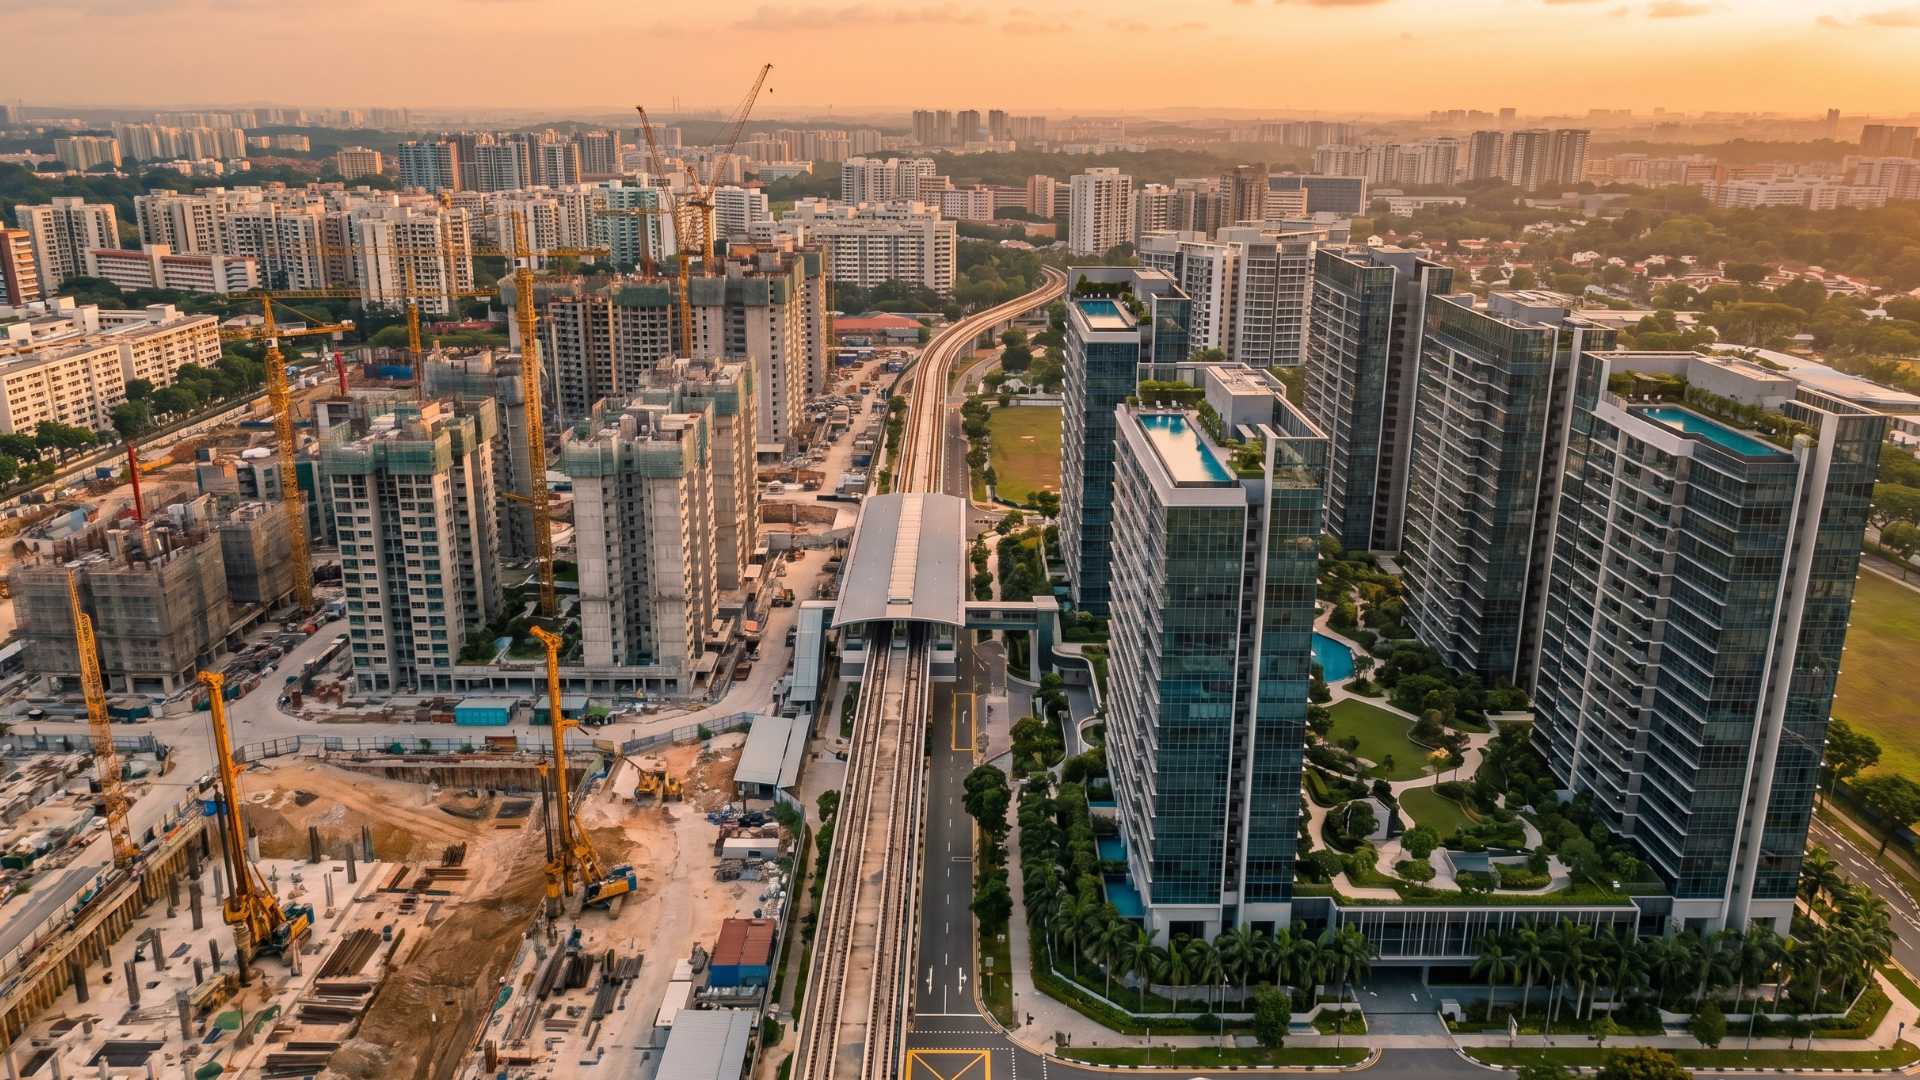
Stage 2: Physical Certainty (Growth Entry) - The Sweet Spot
MRT stations opening. BTO projects completing. Cranes are up.
You can SEE the transformation.
This is where the biggest profits are made — the gap between current pricing and future value is still wide, but the evidence is now visible.
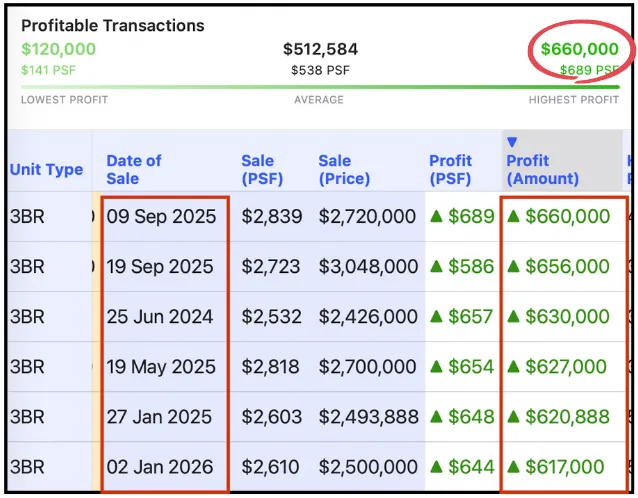
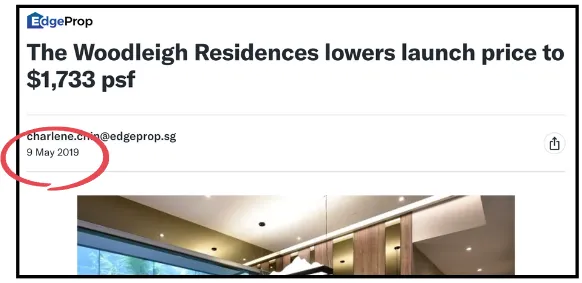
Example: Bidadari. The Woodleigh Residences launched in 2019 at $1,733 psf. Most people still thought "cemetery."
But the MRT was there, roads were realigned, BTOs were completing.
Today's results:
| Unit Type | Purchase PSF | Sale PSF | Average Profit |
|---|---|---|---|
| 3BR | $1,733 | $2,603–$2,839 | $617,000–$660,000 |
$660,000 profit. Because they entered at Physical Certainty before the crowd priced it in.
Example: Lentor. TEL MRT opened August 2021.
Watch the PSF escalation as certainty increased:
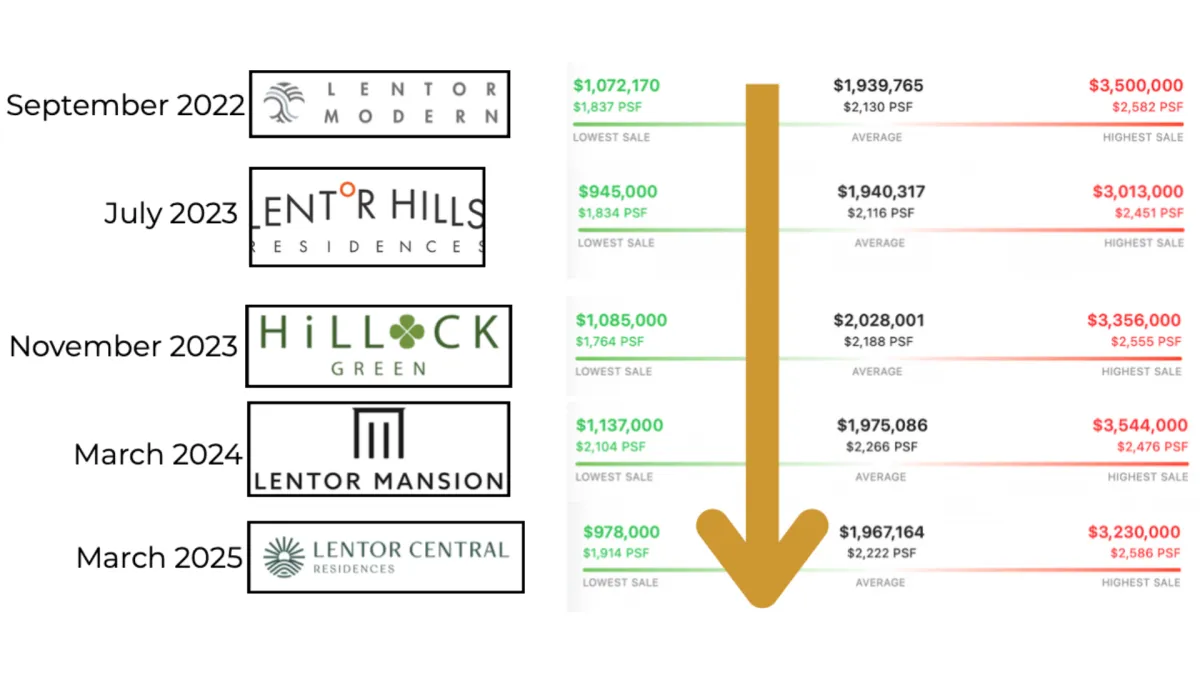
| Launch | Date | Avg PSF |
|---|---|---|
| Lentor Modern | Jul 2023 | $2,130 |
| Lentor Hills Residences | Sep 2022 | $2,116 |
| Hillock Green | Nov 2023 | $2,188 |
| Lentor Mansion | Mar 2024 | $2,266 |
| Lentor Mansion | Mar 2025 | $2,222 |
Early buyers at $2,130 psf are already in the strongest position. Every subsequent launch came in higher.
Stage 3: Lifestyle Certainty (Final Entry)
Area fully developed. Amenities complete. Vibrant community.
Profits are solid but moderate.
You're paying a premium for a finished neighbourhood — the explosive growth is already behind you.

Example: East Coast — Liv @ MB buyers averaged $275K–$354K profit.
Amber Park averaged $264K–$536K. Good numbers. But they entered at $2,368–$2,479 psf versus Woodleigh's $1,733 psf.
Lower entry. Higher profit. Same holding period.
That's the power of buying the right certainty stage.
Now, Let Me Tell You About The Development Today Where The Math Is Flipped...
Remember the brand-new condo at $1.75M - with the 3-year-old development next door at $1.85M+?
Here's why the pricing anomaly is even more dramatic than it looks.
On paper, the older development's 3-bedroom is 883 sq ft.
The new one is 818 sq ft. A 65 sq ft difference.
Most buyers sort by size, see "smaller," and move on, but...
In 2023, Singapore Introduced GFA Harmonisation
It changed how floor area is measured in all new developments.
Under the new rules:
Floor area is measured to the middle of walls, not the outer edge
Air-con ledges are excluded
Void spaces above high ceilings are excluded
The older development was measured the old way.
That 883 sq ft includes wall thickness, air-con ledges you'll never stand on, and void spaces that add nothing to your life.
The new development was measured the new way.
That 818 sq ft is actual usable space.
Overlay the two floor plans room by room and something remarkable shows up:
The new development's living room is slightly bigger. The master bedroom is slightly bigger.
The space you actually cook in, sleep in, live in - same size or larger.
65 sq ft "smaller" on paper. Same or bigger in real life.

*Some agents don't even know this: the new development isn't actually smaller, it just measures smaller!
At $1.75M versus $1.85M+, you're paying roughly $100,000 less for a brand-new unit with a full 99-year lease - and getting the same or more usable space.
That's a deposit-sized difference.
On the same road. Looking at the same trees.
That pricing gap is likely to close as the area's transformation catalysts kick in.
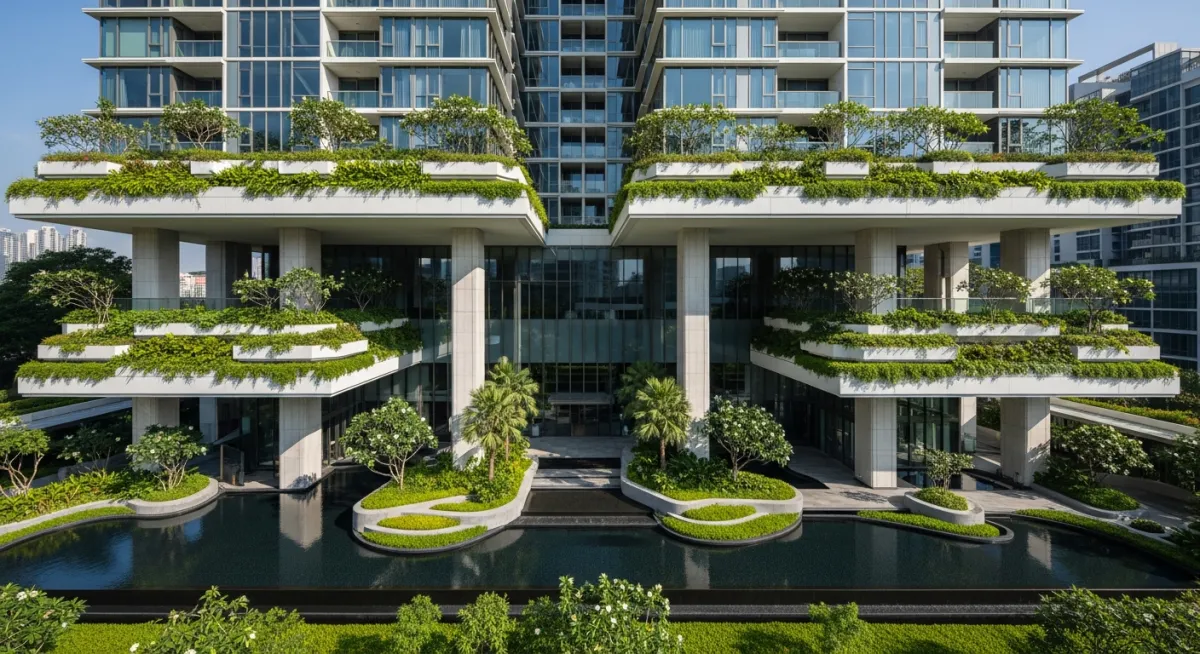
The new development has the lowest entry point per unit of usable space in the entire corridor, the longest remaining lease, and the most modern specifications.
That's Stage 2 pricing. The crowd hasn't caught on. The area doesn't "feel" done. The pricing reflects uncertainty that the data says is about to resolve.
"But There's Too Much Supply?"
I hear this constantly.
You drive through the corridor. Multiple condos. More launches coming.
Your gut says: "Too many units. Hard to sell next time."
Here's the problem: you're looking at today's supply without tomorrow's demand.
That's exactly the mistake buyers make at Stage 2.
They see construction and assume oversupply. They don't see the demand pipeline being built right beside them.
In this specific corridor, there are 30,000 new HDB flats under construction in the adjacent new town.
Those 30,000 flats house families.
Those families move in, serve their 5-year MOP, then become the most financially motivated segment in Singapore's entire property market: upgraders looking for a private condo.
Their typical budget? $1.2M to $1.5M. That happens to be the exact price of a 2-bedroom in this development.
For every unit in this development, there are roughly 8 potential buyers in the surrounding upgrader pool.
Eight to one.
That's a demand funnel. And it's being built right now, next door, where you can see it with your own eyes.
This Is Why The Entry Point Analysis Is Critical For Buyers
This case studies that I shared is not only available - but there are many more hidden gems like this in Singapore, undiscovered, today!
There are also 'Stage 3 traps' that look safe but will cost you hundreds of thousands of dollars.
The truth is - you cannot tell the difference from a showflat, you need the private data that's unavailable to the public.
You need to have
That's why we built the Entry Point Analysis - the same framework we've used privately with clients for years, so you don't have to sign an OTP based on a feeling.

Step 1: Transformation Certainty Mapping
We plot your target project onto the 'Transformation Certainty Matrix' using 2025 URA Master Plan data, infrastructure timelines, and historical transaction records. I'd also show you the detailed numbers and breakdown behind these case studies I've shared. This helps you see which stage you're buying into.

Step 2: Developer Pricing Verification
We compare the launch price against resale transactions, other launches at the same certainty stage, and historical PSF data.
You'll know if you're getting a strategic entry price or overpaying for a mature location.

Step 3: Financial Profile Alignment
We review your ABSD exposure, TDSR headroom, and CPF strategy — including how upcoming policy changes (15-month wait-out relaxation, income ceiling adjustments) affect your specific situation.
At the end, you get one of three outcomes:
Green light — project, pricing, and finances are aligned. Proceed with confidence.
Redirect — better-positioned alternative at a similar price point.
Hold — timing isn't right. We'll outline what needs to change.
This Is For You If:
You're an HDB owner considering upgrading to a new launch
You're a private property owner looking at a second property where ABSD makes entry price critical
You're a first-time buyer who wants to make a multi-million dollar decision based on data, not showflat marketing or real estate agents that pressure you
You're comparing multiple new launches and need an objective framework for which is the best one
Book Your Free Entry Point Analysis
Over 8,000 new private units are expected to launch in 2026.
Every one will have a beautiful showflat and a persuasive sales team.
None of them will tell you which transformation certainty stage their project sits in.
This is what the Free Entry Point Analysis gives you.
"The buyers who made $660,000 at Woodleigh Residences didn't get lucky. They understood transformation before the crowd did."
This Property Investor Framework is helping Singapore buyers avoid costly new launch mistakes.
After 30 months of cycle analysis and 500+ transaction reviews, we developed a system that identifies transformation-stage entries with precision.
After analysing 30 years of Singapore property cycles and over 2,400 new launch transactions, the Entry Point Analysis identifies your unique entry point for your next purchase.
Who This Is For:
HDB owners considering upgrading
Private owners looking for a 2nd property
First-time buyers wanting data-driven decisions
Anyone comparing multiple new launches
Here are the results buyers have experienced with the Entry Point Analysis…

Esther C.
Tampines, Singapore
"Most agents just told me to act fast. Or to buy if it 'feels right' or to secure new launch price fast. What I like about the Entry Point Analysis is that it helps to identify a practical way for the best entry & development. I think that's very rare."

David Y.
Serangoon, Singapore
"I was skeptical because my previous launch appreciated slowly. This helped me to understand why, and gave me a new lens towards how to evaluate new launches in my area, instead of following gut instinct and show-room hype."

Joanne T.
Bishan, Singapore
"As first time buyers, this really helped us feel clear about our entry price and the rationale behind it, rather than feeling pressured into buying. The Transformation Certainty Matrix is a good way to evaluate. I highly recommend."
Entry Point Analysis — Enter The Right Projects!
Book Your Free Custom Analysis Now